


[link] [comments]
/// 12 Aug 2026, 10:59 am ////// ITS FOSS ///

The world is in a messed-up state where surveillance and eroding people's rights are rewarded, and those who oppose are labeled unpatriotic, anti-national, radicals, criminal sympathizers, and what not.
Yet, that doesn't stop people from investing time and money in securing their data by opting for open source mobile operating systems like GrapheneOS and taking steps to improve their privacy in the online world.
One of those steps is to go for a private messaging app that doesn't give out your data to feed some AI or a governmental agency that asks for your data nicely. SimpleX Chat is one such option, a messaging network that doesn't ask for phone numbers, emails, or user accounts.
I tried it out myself back in 2024, and it left a strong impression. The team behind it has kept building since, and now it wants its users to also have a stake in where the project goes next.
Looking for investors

The founder of SimpleX Chat, Evgeny Poberezkin, reached out to us recently, saying that they were looking to give users "the opportunity to get a stake in SimpleX Chat and benefit from its growth."
That stake comes through a SAFE, short for Simple Agreement for Future Equity, live now on Wefunder.
The first $450,000 invested gets an Early Bird SAFE with a $40 million valuation cap. Once that fills up, later investors get a separate SAFE instead, this one at a $45 million cap.
There's a wrinkle though. Your money doesn't go straight into a SAFE with SimpleX Chat itself. It goes into an SPV, which is the entity that actually holds the SAFE, and your signature ends up on the SPV's own Subscription Agreement instead.
So this comes up as one version for early money, another for everyone who invests after.
The campaign's friends-first soft launch closes August 15, and as of August 11, it had already raised 50% of its target offering amount.
The company behind the app isn't quite what it used to be either. SimpleX Chat Ltd, the UK entity that built the app, is now a wholly owned subsidiary of a new US company, SimpleX Chat, Inc.
Keep that in mind if you consider where a firm is based out of before investing in it.
If the campaign only clears its $50,000 minimum target, the money would go toward covering general operating expenses, just enough to keep things running a while longer.
Hitting the full $1,235,000 target would mean they could hire additional team members, build out a browser-based messaging stack, provide tools for publishers, and work on a framework for interactive widgets.
The company also expects server hosting costs to fall as more independent operators take over network infrastructure, while planning to break even using revenue from public names, business services, and what it calls Community Credits.
That is a model for getting large channels to pay for the servers they use.
Before you go ahead and invest, do understand that this comes with the usual risks of backing a company this early.
There's no guarantee of a return, and what you invest isn't something you can sell easily if you change your mind. The company's own filing goes further, stating it doesn't expect to have enough cash to keep running for the next 12 months without more funding.
A similar occurence
We already had an instance of a messaging app asking its community for help earlier this year, where Session nearly shut down after it ran out of funding, needing $1 million to keep going.
By June, the foundation confirmed development had resumed, backed by two to three developers instead of the dozen-plus it once employed.
SimpleX Chat's own filing admits it doesn't have enough cash to keep going for the next 12 months without more funding either. Raising money through equity now, rather than an emergency donation drive, gives it a strong start.

/// 12 Aug 2026, 11:13 am ////// The Hacker News ///
/// 12 Aug 2026, 10:06 am ////// GamingOnLinux ///

Read the full article on GamingOnLinux.
/// 12 Aug 2026, 12:08 pm ////// Google News ///
/// 12 Aug 2026, 4:40 am ////// 9to5Linux ///

QEMU 11.1 open-source virtualization software is now available for download with Universal Flash Storage (UFS) emulation support, ARM and RISC-V improvements, and more.
The post QEMU 11.1 Released with Universal Flash Storage (UFS) Emulation Support appeared first on 9to5Linux - do not reproduce this article without permission. This RSS feed is intended for readers, not scrapers.
/// 12 Aug 2026, 12:09 pm ////// Linux Links ///
Rethink VMware standardization after VMware licensing changes. Discover how Sangfor HCI helps reduce vendor lock-in, control costs, and simplify IT operations.
The post Why Large Enterprises Are Reassessing Infrastructure Standardization After VMware Licensing Changes appeared first on LinuxLinks.
/// 11 Aug 2026, 11:00 pm ////// Slashdot ///


Read more of this story at Slashdot.
/// 7 Aug 2026, 9:57 pm ////// FSF News ///
/// 10 Aug 2026, 8:00 am ////// Fedora Magazine ///
You wake up one morning to find your home server unresponsive, after some investigation you discover a failed NVMe drive taking your self-hosted services and data with it. Perhaps you’re a system administrator and a workstation’s SSD has been silently accumulating errors for months, and now a user is reporting corrupted files.
Drive failures are rarely instant, they give subtle warnings (through rising temperatures, increasing error counts, and wear indicators) but only if you’re watching. Most people will only check on disk health after problems start, by then it may be too late.
Performance Co-Pilot (PCP) is an open source framework for collecting, monitoring, and analyzing system performance metrics. Recent updates have expanded its drive monitoring capabilities with:
- SMART metric collection for HDDs, SSDs, and NVMe drives
- NVMe error log decoding with human-readable error messages
- WWID-based drive tracking that survives device name changes across reboots
- Seagate FARM telemetry for extended vendor-specific diagnostics
In this post, you’ll set up PCP drive monitoring on Fedora, learn which metrics matter most, and build a Grafana dashboard to visualize your drive health over time.
Prerequisites
To follow along, you’ll need:
- Fedora Workstation or Server (Fedora 39 or later recommended)
- Root or sudo access for installing packages and PMDAs
- smartmontools installed (PCP’s SMART agent depends on smartctl)
You can verify smartmontools is available:
$ rpm -q smartmontools
If it’s not installed:
$ sudo dnf install smartmontools
What is SMART?
SMART (Self-Monitoring, Analysis and Reporting Technology) is a monitoring system built into modern hard drives, SSDs and NVMe devices. SMART continuously tracks indicators like wear leveling, error rates, temperature and power-on hours. These are reliability metrics that can help point towards impending failures.
Most people only check SMART data once, using tools like smartmontools (smartctl -a /dev/sda) and only when they already suspect a problem. That approach only gives you a single snapshot. PCP takes a different approach: its SMART agent collects these metrics continuously in the background, building historical trends that you can analyze.
Did your drive’s temperature spike yesterday during a large file transfer? Has your NVMe wear indicator increased from 5% to 15% over the past six months? Continuous monitoring catches these patterns. Drive failures rarely happen without warning, clues are given through SMART values that shift over time.
Installing and enabling PCP with the SMART PMDA
Getting started is straightforward. Install the required packages:
$ sudo dnf install pcp pcp-pmda-smart
The pcp-pmda-smart package provides the SMART monitoring agent. Next, install the PMDA (Performance Metrics Domain Agent):
$ cd /var/lib/pcp/pmdas/smart/
$ sudo ./Install
The installer will prompt for configuration options. The defaults work well for most setups, so press Enter to accept them.
Start and optionally enable the PCP collector daemon:
$ sudo systemctl start pmcd
$ sudo systemctl enable pmcd
Verify the SMART metrics are available:
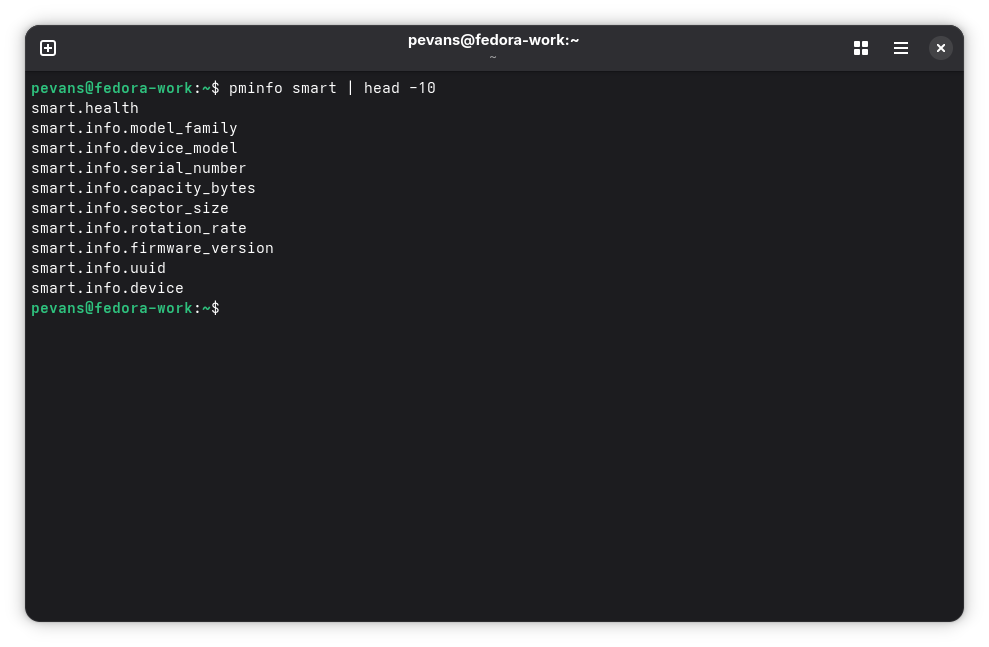
If you see metrics listed, you’re ready to go.
Querying SMART metrics
Now that monitoring is running, let’s look at the metrics that matter most.
Temperature
Drive temperature is one of the easiest health indicators to track. Query it with:
$ pminfo -ft smart.attributes.temperature_celsius.value
For NVMe drives, use:
$ pminfo -ft smart.nvme_attributes.temperature_sensor_one
As a general guideline: sustained temperatures above 60 °C for HDDs or 70 °C for SSDs and NVMe drives indicate potential cooling problems. Consistent high temperatures accelerate wear and reduce drive lifespan.
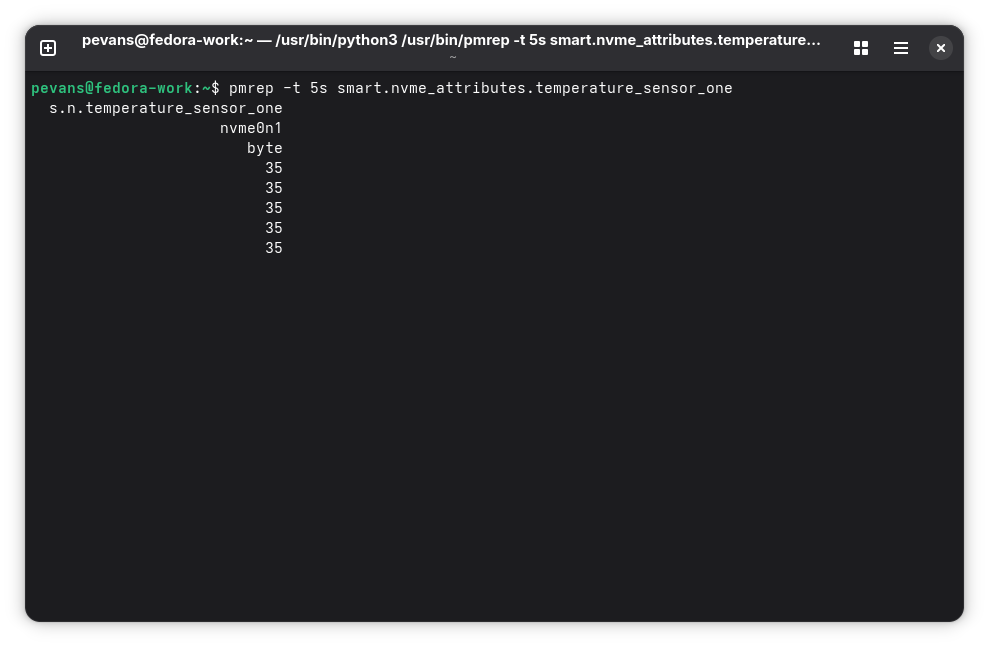
To watch temperatures update in real time (every 5 seconds):
$ pmrep -t 5s smart.nvme_attributes.temperature_sensor_one smart.attributes.temperature_celsius.value
Press Ctrl+C to stop.
Wear and age indicators
Every drive has a finite lifespan. These metrics help you track where a drive is in its lifecycle.
Power-on hours tracks total runtime:
$ pminfo -ft smart.attributes.power_on_hours.value
$ pminfo -ft smart.nvme_attributes.power_on_hours          # NVMe
A drive with 50,000 hours (roughly 5.7 years of continuous operation) is significantly older than one with 5,000 hours.
Power cycle count shows how many times the drive has been powered on and off:
$ pminfo -ft smart.attributes.power_cycle_count.value
$ pminfo -ft smart.nvme_attributes.power_cycles             # NVMe
Excessive power cycling can accelerate mechanical wear in HDDs and contribute to flash cell wear in SSDs.
For NVMe drives, smart.nvme_attributes.percentage_used is the most important wear metric. It runs from 0 to 100%, reflecting the drive’s consumed endurance. Above 80% means significant wear. Above 90%, start planning a replacement.
$ pminfo -ft smart.nvme_attributes.percentage_used
Critical error metrics
These are the metrics you hope stay at zero. Any non-zero value or an increasing trend points to physical drive problems.
Reallocated sector count shows bad sectors that the drive has detected and remapped to spare areas. Modern drives reserve sectors for this purpose but once remapping starts it signals deteriorating media:
$ pminfo -ft smart.attributes.reallocated_sector_count.value
Current pending sector count tracks sectors waiting to be remapped. A non-zero value suggests the drive is actively struggling with bad areas:
$ pminfo -ft smart.attributes.current_pending_sector.value
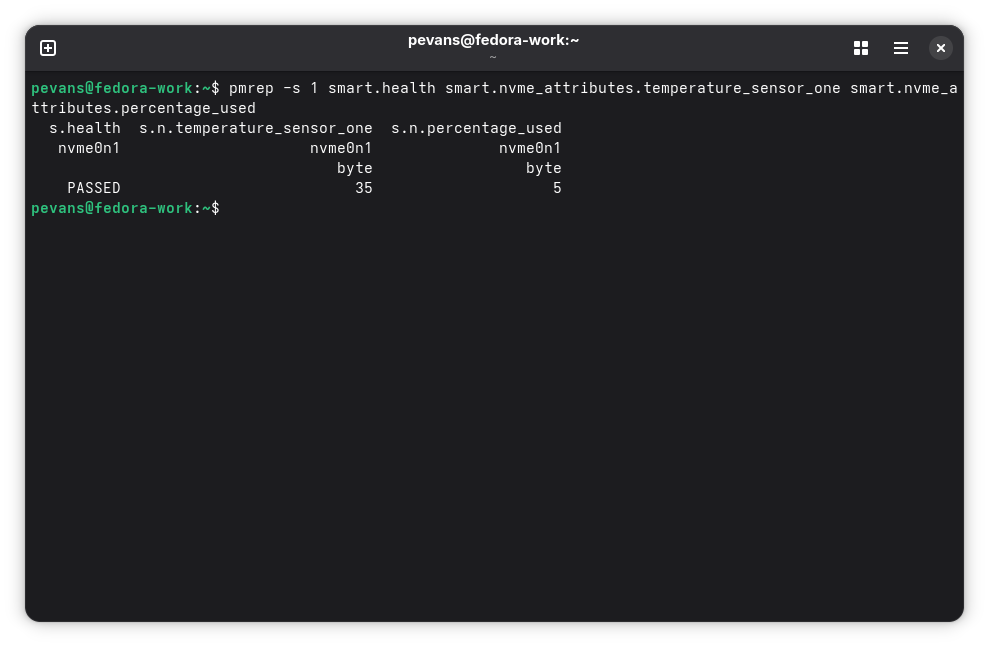
For a quick overview of all drives at once:
$ pmrep -s 1 smart.health smart.attributes.temperature_celsius.value smart.nvme_attributes.temperature_sensor_one smart.nvme_attributes.percentage_used
WWID-based drive tracking
A common challenge with drive monitoring is that device names can change. Your NVMe drive might be /dev/nvme0n1 today but after a reboot or BIOS update it could become /dev/nvme1n1. Hot-plugging USB drives or adding new storage can also shuffle device assignments.
PCP solves this with the smart.wwid.* metric namespace. WWID (World Wide Identifier) is a unique identifier assigned to each drive during manufacturing. It never changes regardless of how the operating system names the device.
Here’s the difference in practice:
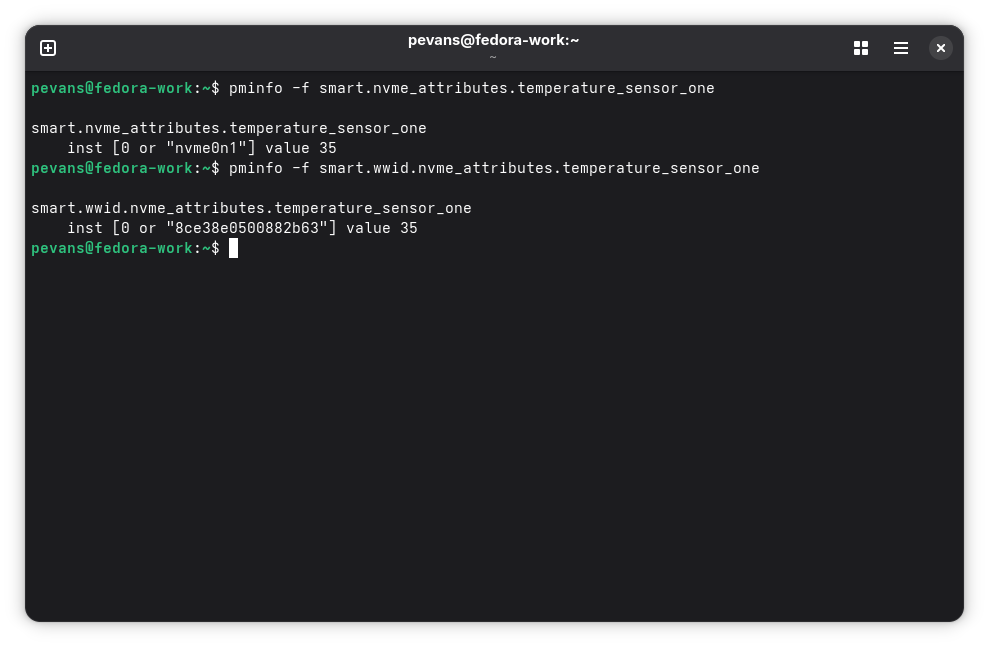
The WWID-based namespace is particularly useful for multi-drive setups (home lab servers, workstations with external drives, or laptops with docking stations). Your monitoring history stays consistent even when device names don’t.
NVMe error log collection
Beyond standard SMART attributes, NVMe drives maintain a detailed error log (log page 0x01) that records every error event the drive encounters. The SMART PMDA can collect and decode these logs giving you visibility into issues that basic SMART counters won’t reveal.
While smart.nvme_attributes.media_and_data_integrity_errors gives you a count, the error log tells you what happened, when it happened, and where on the drive it occurred. Each log entry includes:
- Error type and status code
- Command that triggered the error
- Logical block address (LBA) of the failure
- Namespace and submission queue information
- Timestamp of the error event
This level of detail helps diagnose intermittent problems. Maybe your NVMe drive only throws errors under specific workloads or errors cluster in a particular address range.
Query the error log metrics:
$ pminfo -ft smart.nvme_error_log
The most important metric is smart.nvme_error_log.error_count which should be zero on a healthy drive. If you see non-zero values, check smart.nvme_error_log.status_code for human-readable error descriptions. Common error codes include:
- Data Transfer Error: Problem reading or writing data
- Internal Device Error: Controller or firmware issues
- Aborted Command: Command was cancelled or timed out
- Write Fault: Write operation failed
Recurring errors, especially with the same status code or affecting the same LBA range indicate a real problem that needs attention.
FARM log support for Seagate drives
If you have Seagate drives, PCP offers additional monitoring through the FARM (Field Accessible Reliability Metrics) PMDA. FARM is Seagate’s extended monitoring that goes beyond standard SMART, providing deeper insights into drive behavior.
What FARM provides
FARM logs capture operational data that SMART doesn’t track:
- Power metrics: Per-head write power hours, total power-on hours with finer granularity
- Error history: Read and write error rates broken down by head and zone
- Performance data: Command latency statistics, queue depth tracking
- Environmental history: Temperature trends over the drive’s lifetime, humidity exposure
- Workload patterns: Sequential vs. random I/O ratios, read/write balance
- Head-specific statistics: Individual read/write head performance (for HDDs)
Setting up the FARM PMDA
FARM support works for both SATA and SAS Seagate drives. Install and enable it:
$ sudo dnf install pcp-pmda-farm
$ cd /var/lib/pcp/pmdas/farm/
$ sudo ./Install
Query available FARM metrics:
$ pminfo farm | head -10
farm.smart_attribute.power_on_hours
farm.environment.current_temperature
farm.reliability.uncorrectable_read_errors
farm.reliability.uncorrectable_write_errors
...
FARM is especially useful for tracking long-term health trends, diagnosing subtle issues not visible in basic SMART data and verifying that drive specifications match actual usage.
Note: FARM metrics are Seagate-specific. They won’t work with Western Digital, Samsung, or other manufacturers. For universal monitoring use the SMART PMDA covered earlier.
Visualizing with Grafana
PCP integrates with Grafana through the grafana-pcp plugin, letting you build dashboards that visualize drive health over time. This is where continuous monitoring pays off. You can spot trends, set up alerts and keep an eye on your entire fleet of drives from a single dashboard.
Installing the Grafana PCP plugin
Install Grafana and the PCP plugin:
$ sudo dnf install grafana grafana-pcp
Start the required services:
$ sudo systemctl start grafana-server pmproxy
$ sudo systemctl enable grafana-server pmproxy
Open Grafana in your browser at http://localhost:3000 (default credentials: admin/admin).
Before adding a datasource, you may need to enable the Performance Co-Pilot plugin. Go to Administration > Plugins and data > Plugins, search for Performance Co-Pilot, and click Enable. If the plugin is already enabled, you can skip this step.
Configuring the PCP Vector datasource
Go to Connections > Data sources > Add data source and select PCP Vector. The only required field is the URL:
http://localhost:44322
Click Save & Test to verify the connection.
Building drive monitoring panels
Below are panel configurations you can use in your dashboards. To add a panel, click Add > Visualization on any dashboard, select the PCP Vector datasource and enter the metric name in the query field.
Drive temperature timeseries panel:
This panel shows drive temperature over time, with color thresholds for warning levels.
{
  "type": "timeseries",
  "title": "Drive Temperature",
  "datasource": {
    "type": "pcp-vector-datasource",
    "uid": "PCP_VECTOR"
  },
  "targets": [
    {
      "expr": "smart.nvme_attributes.temperature_sensor_one",
      "format": "time_series"
    },
    {
      "expr": "smart.attributes.temperature_celsius.value",
      "format": "time_series"
    }
  ],
  "fieldConfig": {
    "defaults": {
      "unit": "°C",
      "thresholds": {
        "mode": "absolute",
        "steps": [
          { "color": "green", "value": null },
          { "color": "yellow", "value": 50 },
          { "color": "orange", "value": 60 },
          { "color": "red", "value": 70 }
        ]
      },
      "custom": {
        "thresholdsStyle": { "mode": "area" }
      }
    },
    "overrides": [
      {
        "matcher": { "id": "byType", "options": "number" },
        "properties": [
          { "id": "unit", "value": "°C" }
        ]
      }
    ]
  },
  "gridPos": { "h": 8, "w": 24, "x": 0, "y": 0 }
}
NVMe wear percentage gauge panel:
A gauge showing how much of each NVMe drive’s endurance has been consumed.
{
  "type": "gauge",
  "title": "NVMe Wear Level",
  "datasource": {
    "type": "pcp-vector-datasource",
    "uid": "PCP_VECTOR"
  },
  "targets": [
    {
      "expr": "smart.nvme_attributes.percentage_used",
      "format": "time_series"
    }
  ],
  "fieldConfig": {
    "defaults": {
      "unit": "percent",
      "min": 0,
      "max": 100,
      "thresholds": {
        "mode": "absolute",
        "steps": [
          { "color": "green", "value": null },
          { "color": "yellow", "value": 50 },
          { "color": "orange", "value": 80 },
          { "color": "red", "value": 90 }
        ]
      }
    },
    "overrides": [
      {
        "matcher": { "id": "byType", "options": "number" },
        "properties": [
          { "id": "unit", "value": "percent" }
        ]
      }
    ]
  },
  "gridPos": { "h": 6, "w": 8, "x": 0, "y": 8 }
}
Drive health status panel:
A stat panel showing the overall health assessment for each drive.
{
  "type": "stat",
  "title": "Drive Health Status",
  "datasource": {
    "type": "pcp-vector-datasource",
    "uid": "PCP_VECTOR"
  },
  "targets": [
    {
      "expr": "smart.health",
      "format": "time_series"
    }
  ],
  "fieldConfig": {
    "defaults": {
      "unit": "string",
      "mappings": [
        {
          "type": "value",
          "options": {
            "PASSED": { "text": "PASSED", "color": "green" },
            "FAILED": { "text": "FAILED", "color": "red" }
          }
        }
      ]
    },
    "overrides": [
      {
        "matcher": { "id": "byType", "options": "string" },
        "properties": [
          { "id": "unit", "value": "string" }
        ]
      }
    ]
  },
  "gridPos": { "h": 6, "w": 8, "x": 8, "y": 8 }
}
A complete, importable Grafana dashboard JSON file is provided alongside this post as pcp-drive-monitoring-dashboard.json. Import it via Dashboards > Import in Grafana.

Automated alerting with pmie
PCP includes pmie (Performance Metrics Inference Engine), a rule-based tool that evaluates metric expressions and triggers actions when conditions are met. Where Grafana dashboards require someone to be watching pmie can alert you automatically.
To start and optionally enable pmie:
$ sudo systemctl start pmie
$sudo systemctl enable pmie
Exploring metrics with pmie
Before writing alerting rules you can use pmie in verbose mode to view metrics from the command line. This is a useful way to get familiar with the syntax:
$ echo 'temp_check = smart.nvme_attributes.temperature_sensor_one;' | pmie -e -v -t 5second
temp_check (Mon Jun 30 10:15:01 2026): 35

temp_check (Mon Jun 30 10:15:06 2026): 35

temp_check (Mon Jun 30 10:15:11 2026): 36
Press Ctrl+C to stop. The -e flag shows the evaluated expression, -v shows values even when no action fires, and -t sets the evaluation interval.
You can add conditions and actions to turn this into a rule. Here’s an example that prints a message whenever an NVMe drive’s temperature is above 0 (effectively showing all drives):
$ echo 'temp_check = some_inst(smart.nvme_attributes.temperature_sensor_one > 0) -> print "NVMe temp:" " %i:%v";' | pmie -e -v -t 5second
Mon Jun 30 10:15:01 2026: NVMe temp: nvme0n1:35
temp_check (Mon Jun 30 10:15:01 2026): true

Mon Jun 30 10:15:06 2026: NVMe temp: nvme0n1:36
temp_check (Mon Jun 30 10:15:06 2026): true
The %i token expands to the instance name (the drive) and %v to the metric value.
Writing alerting rules
Now let’s create practical rules that alert on real problems. Save the following to /etc/pcp/pmie/smart-health.pmie:
// Alert if any NVMe drive temperature exceeds 70 °C
some_inst(smart.nvme_attributes.temperature_sensor_one > 70)
    -> syslog 10 min "NVMe drive temperature critical:" " %i at %v °C";

// Alert if any NVMe drive wear level exceeds 80%
some_inst(smart.nvme_attributes.percentage_used > 80)
    -> syslog 24 hour "NVMe drive wear level high:" " %i at %v%";

// Alert if any drive has reallocated sectors
some_inst(smart.attributes.reallocated_sector_count.value > 0)
    -> syslog 24 hour "Drive has reallocated sectors:" " %i with %v sectors";
The syslog action writes to the system log with the tag pcp-pmie. The time after syslog (e.g., 10 min, 24 hour) is a throttle that prevents repeated alerts, so you won’t flood your logs if a condition stays true.
Testing and running pmie rules
Test your rules from the command line first:
$ sudo pmie -v -c /etc/pcp/pmie/smart-health.pmie -t 10second
This evaluates the rules every 10 seconds and prints verbose output so you can see them firing. Once you’re happy with the rules you can run pmie as a persistent service. The system-wide pmie instance is managed by pmie_check and configured in /etc/pcp/pmie/control. Add an entry pointing to your rules file to have them evaluated continuously alongside the default PCP rules.
A complete smart-health.pmie rules file covering temperature, wear and error alerts for both NVMe and SATA drives is provided alongside this post in the conclusions section. Copy it to /etc/pcp/pmie/ to get started.
Other actions are available beyond syslog. Use shell to run arbitrary commands (such as sending an email or desktop notification), print for stdout output or chain actions with & to run multiple actions when a rule fires.
Continuous monitoring with pmlogger
pmlogger is a core utility included with PCP, and automatically logs metrics when running. To start it and enable it on boot:
$ sudo systemctl start pmlogger
$ sudo systemctl enable pmlogger
By default, pmlogger captures a broad set of system metrics. To ensure SMART drive metrics are included, run:
$ sudo pmlogconf -r /var/lib/pcp/config/pmlogger/config.default
When prompted, enable the S.M.A.R.T drive statistics [Linux] group. This ensures drive health metrics are captured continuously, allowing you to review historical trends using tools like pmchart, pmrep, or Grafana with the PCP Valkey datasource.
With pmlogger running, you build a historical record of your drive health. If a drive starts failing in six months, you can look back and see exactly when the warning signs began.
Conclusion
Drive failures give warnings, through SMART metrics, error logs and performance degradation. With PCP’s drive monitoring capabilities you have the tools to catch these warnings before they become data loss.
In this post we covered setting up the SMART PMDA for universal drive health monitoring, interpreting key metrics like temperature, wear levels, error counts and tracking drives reliably with WWID-based identifiers. NVMe users can go deeper with error log collection and Seagate drive owners have access to extended FARM telemetry. Combined with Grafana dashboards and pmlogger you get continuous visibility into your drives’ health.
The key takeaway: continuous monitoring catches trends that one-time checks miss. A few minutes of setup today can save hours of recovery work (or worse, unrecoverable data loss) tomorrow.
For more information, visit the Performance Co-Pilot documentation and the grafana-pcp plugin documentation. The Grafana dashboard used in this post is available to download here and can be imported via Dashboards > Import in Grafana. The pmie alerting rules are also available to download here and can be copied to /etc/pcp/pmie/ for use with pmie.
/// 10 Aug 2026, 1:21 am ////// Linuxtech ///
/// 12 Aug 2026, 6:56 am ////// Tecmint ///
Rio is a GPU-accelerated terminal emulator written in Rust that gives you built-in tabs, splits, and a command palette. So
The post Rio Terminal for Linux: Speed Up Your Command-Line Workflow first appeared on Tecmint: Linux Howtos, Tutorials & Guides./// 10 Aug 2026, 4:58 pm ////// Linux Magazine ///
Unless a kernel patch is a valid security fix, it will be rejected if it was created using AI.